Android Income Report #8 (November 2011)

Euro CashOverview

In my October report, I described how this one simple app turned into an overnight success. Fake iPhone 4S brought in over $700 in October alone, helping to bring my total earnings for that month over the nominal target of $1000.

In November, these already fantastic results improved in every way. Total Active Installs went from ~140,000 at the end of October to over 400,000 by mid-November. By the end of November, I’d reached about 1.2 million total installs. This boost in downloads seemed to be mostly self-propagating. By reaching the top Trending charts for the Android Market, it was noticed by a lot of people, which in turn helped keep it in the top charts.

It still amazes me that an app which I created as a casual idea in my free time would reach this level of popularity. There’s no way I would have predicted this number of people could be interested in downloading a Fake iPhone. But I tried it – and apparently a lot of people do want this kind of app.

Anyway, this torrent of new users brought a proportional increase in revenue. In fact, during November I brought in an average of over $200 per day! This was an incredibly exciting month for me – and busy too, as I released a number of updates.

Read more

Android Income Report #7 (October)

Statistics bar graphWhen I started this blog, I set myself a goal: to make $1000 from Android development in a single month. This seemed a lofty goal – especially starting from scratch – but I thought it would be achievable within a couple of years. Thus it was quite a surprise in July when I got nearly halfway there – $690 in a single month. This was just 4 months after my first income report of less than $4!

Even more surprising – and exciting – is the news that this month, I passed the $1000 mark. Yes, after 7 months of Android development I’ve actually reached the goal set back in March. This was mainly due to the phenomenal success of my latest app – “Fake iPhone 4S“.

Read on for more details, including the full story of how one weekend’s work turned into my most successful app yet.

Read more

Android Income Report #6 (September)

September was my first month back in the swing of things, after the August holiday. It was still pretty quiet, with no new app releases, but I was able to do a bit of groundwork in preparation for the coming months. I wrote a number of blog posts, and tried submitting my app to a few more alternative app stores. Revenues saw a bit of dip compared with August, but this was still my 3rd highest income to date.

This will be another short income report – I’m a few months behind already, so will try to keep things brief. Without any further ado, here’s the breakdown for September – my 6th month on the Android Market.

Read more

Android Income Report #5 (August)

Well, I’ve got way behind in my income reports. My last report (July 2011) is over 3 months old already. It’s good to keep the continuity though, so I’ll publish this post for my August revenue – even though it wasn’t a very exciting month. The huge revenues from my Google+ Invites app had diminished significantly, and I was travelling overseas for most of the month, so didn’t release any updates for my other apps. So mainly, this month’s report covers passive income from my existing apps, during a month of inactivity.

Read more

Android Income Report #3

ChartHere’s an interesting stat for you – this month, I made more money writing about Android than I did from Android apps themselves! How does that work? Well, this blog has seen a pretty steady increase in traffic since I wrote the first article at the beginning of April. A couple of weeks ago, that same article made it to the front page of Hacker News, which was a catalyst for this website – over 20,000 new visitors in one day. Thanks in part to the dramatic increase in traffic, my Google AdSense earnings were high enough this month to justify including them in this report. In fact, they exceeded my AdMob earnings by a significant margin.

Also, you’ll probably notice I’m no longer using the title “xx month on the Android Market”. That’s simply because from now on, I’ll be expanding beyond Google’s distribution channel, and trying out alternative app stores such as Amazon, GetJar and SlideME. The Android Market is still my first and primary focus though.

Read more

Second Month on the Android Market

Statistics bar graphThis post is a little late, but I’ll summarise the monthly stats here in order to present the full picture. My second month (9th May – 8th June) has been pretty straightforward, with Tap That! Number seeing regular growth in much the same pattern as the first month. I’ve now diversified a bit, releasing two new apps which has helped bump up the advertising revenue. Work and study commitments prevented me from spending a lot of time in actual development, but I did manage to push a major update to Tap That! Number – a new “memory mode” with hidden tiles. Read on for the full details from this month’s development, and a look at how the Flurry tracking service compares to Google Analytics.

Read more

Hacker News: The Aftermath

Yesterday, on a whim, I decided to submit one of my articles to Hacker News. I didn’t really expect anything to come of it, due to my previous experience with sites like Digg and Reddit. Well, I was wrong. The article hit the front page of HN within minutes, and stayed there for over 10 hours. By the end of the day (Australian time), this website had handled over 7,000 visitors – which is about 6,500 more than a normal day.
Today, the same article has been featured on Reddit, Twitter and The Next Web, resulting in another 20,000 visits so far. All that exposure has resulting in some very interesting comments from Android and iOS developers alike. I’ve previously been writing for a fairly small audience, it’s a bit of a different experience to get critical review from all over the web. So what have I learned? Two things – that WordPress scales well with caching, and that there’s always someone with a different point of view.

Read more

First Month on the Android Market

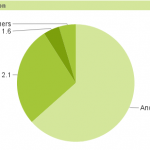
Chart showing Android version distributionIt’s been one month now since I published my first app on the Android market. I thought this would be a great time to share some stats from the first few weeks – how many downloads, how much revenue from AdMob, user engagement figures – all that stuff. Hopefully this will give you some idea of how far I’ve come with this first app in one month, and what opportunity there is for further growth. There are plenty of screenshots, so you’ll get to see exactly what has been happening in detail.

Read more