 Here’s an interesting stat for you – this month, I made more money writing about Android than I did from Android apps themselves! How does that work? Well, this blog has seen a pretty steady increase in traffic since I wrote the first article at the beginning of April. A couple of weeks ago, that same article made it to the front page of Hacker News, which was a catalyst for this website – over 20,000 new visitors in one day. Thanks in part to the dramatic increase in traffic, my Google AdSense earnings were high enough this month to justify including them in this report. In fact, they exceeded my AdMob earnings by a significant margin.
Also, you’ll probably notice I’m no longer using the title “xx month on the Android Market”. That’s simply because from now on, I’ll be expanding beyond Google’s distribution channel, and trying out alternative app stores such as Amazon, GetJar and SlideME. The Android Market is still my first and primary focus though.
Report Period
Since I released my first app on the 8th of April, all my monthly reports so far have been offset by 8 days from the start of the month. This is getting a bit confusing, so I’ve decided to make a change. This report will cover a period slightly less than a month– from the 9th of June, to the 30th of June. That way I can start the next report on the 1st July. So this month’s figures will be artificially low, compared with what they would be for a full 30-day period. I don’t think this has a huge impact on the overall picture, but it’s something to bear in mind while interpreting the results below.
Website Traffic
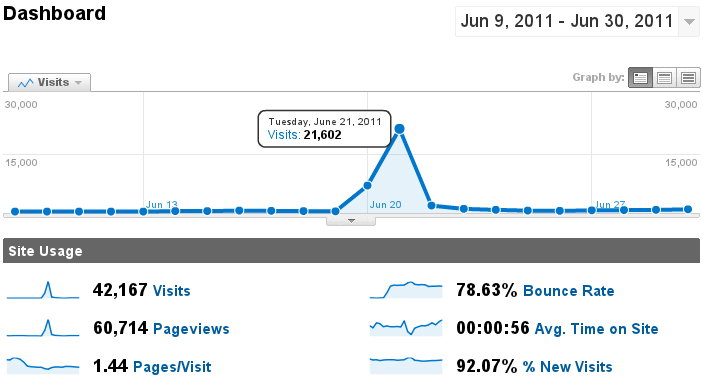
Take a look at the Google Analytics chart for this month:

Yep – that big spike is the result of Hacker News/Reddit. Naturally things fell back to normal levels within a few days, but I’ve still been getting pretty good traffic since then. The amount of feedback I received has been amazing, and provided great food for thought. It’s really interesting to hear the thoughts of iOS developers when they read the article, and compare the Android ecosystem to Apple’s offering. I wrote about that in a previous post, so check it out for more details.
The popularity of the website has had an impact on my app development as well. I received emails from several companies offering advertising libraries and game development engines for Android. I’ll be investigating some of these in the coming months. Also, I’ve been in contact with a few other developers, to learn how they go about things in the Android world. The increased exposure has been really helpful, as I’ve been able to look at my development from a different perspective. I’ve also received some insightful comments and feedback about my current Android apps, which is always valuable to know.
Google AdSense
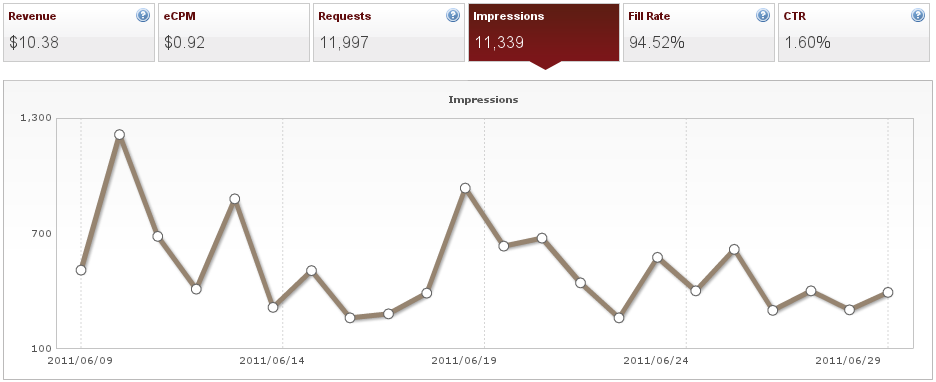
As I mentioned earlier in the post, this is the first month I’ve got any significant revenue from AdSense. I can’t share a full screenshot with you (due to the AdSense TOS), but I’ve posted a redacted version below. This month in total I earned $47.78 from AdSense. To put that in perspective, it’s more than I’ve earned from AdMob in the past 3 months combined. 🙂 Of that revenue, about $20 came directly from the traffic spike on the 21st, the rest came in over the course of the month.

I got about 5 times as many impressions from AdSense than I did from AdMob. However, the RPM (revenue per thousand impressions) was about the same for both networks. I thought this was noteworthy – bearing in mind that AdSense is also used to fill the inventory for AdMob at times.
Free Apps – AdMob
This month my AdMob earnings rose again, by a couple of dollars. This is actually better than it looks, because these earnings are for a 3 week period, not a full month.

I didn’t release many updates during this time, so it’s nice to see the revenue keeping reasonably steady towards the end of the month. This month’s AdMob revenue for all apps was $10.38.
Paid Apps
As of June 30th, I still didn’t have any paid apps on the Android Market (or any other app stores). This coming month (July) I’ll be reporting on my first paid app, and how the revenue compares to ad-supported apps.
Android Market Stats
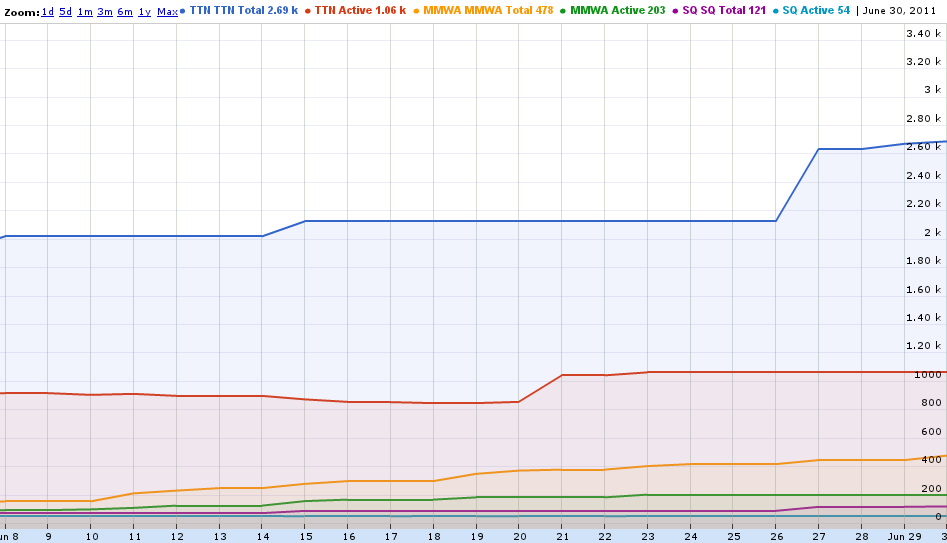
To give you an idea of how my various apps are doing in comparison with each other, I’ve been tracking all my Android Market stats in a separate spreadsheet. Total Installs and Active Installs are the two main metrics, which I’ve been recording every couple of days. I’ve drawn up a chart using Google Docs, which you can see below:

The abbreviations:
- TTN – Tap That! Number (game)
- MMWA – Making Money With Android (official app for this blog)
- SQ – Simple Quotes (a very quick & simple “quote of the day” style app)
There were a couple of interesting things I found by charting the apps side-by-side. Firstly, the Android Developer Console updates very erratically, and often the “total installs” and “active installs” for a single app will be out of sync with each other. As you can see in the chart, TTN gained about 200 new “active users” around the 20th. But the “total installs” didn’t change at all until the 26th. The figures obviously contradict each other, and I’ve seen this happen often with the Developer Console. In fact, when I first released one of my apps, it displayed “0 total installs, 43 active users”. Um, really?
Given these significant reporting errors in the Developer Console, can it be trusted at all? Well, from what I’ve seen the figures do line up with reports from Google Analytics and Flurry. They’re simply delayed by a matter of hours, days, or even weeks – seemingly arbitrarily. This is something I think Google should definitely fix. Ideally, live stats would be of tremendous benefit to developers. When my app goes viral, or gets published on a major app review website, I want to know about it now – not 5 days down the track.
Inconsistencies aside, there are some interesting trends visible in this chart. TTN (the game) tends to have a large jump in downloads whenever I release an update. But this quickly flatlines after a couple of days. On the other hand, MMWA (the blog client) has seen steady growth over the course of the month – with no updates released at all. The game TTN is by far the most popular of my apps, but really the popularity seems to come from being in the “Just In” list. I think this is probably due to the app name – people must search for money & android more often than they search for tapping & numbers.
This month, Tap That! Number reached ~2,600 total installs on the Android Market.
SlideME
 This month I also started tracking Tap That! Number on the SlideME marketplace. This is an alternative “app store” (if you want to call it that), compared to the Android Market. This website doesn’t really offer any kind of reporting for developers, so I don’t have a chart. So far, Tap That! Number has 608 total downloads from SlideME. That’s quite decent, considering that it’s a third-party website with a much smaller user base than the Android Market. It’s about 25% of my Android Market downloads, and I’m pretty sure the total number of SlideME users is much less than a quarter of all Android users.
I would love to see SlideME get some decent developer reports though. At present I just find it difficult to navigate through the admin interface, and there’s no real way of tracking how well your app is doing.
Summary
Some totals for the “month” from 9th June to 30th June:
- Number of apps: 3
- Android Market installs (cumulative): 3,288 (+1,037)
- Android Market installs (active): 1,321 (+254)
- SlideME installs (cumulative): 608
Total installs (all app stores): 3,896 (+1,645)
And the revenue figures:
- AdMob Impressions: 11,339 (-2,376)
- AdMob Earnings: $10.38 (+1.82)
- AdSense Earnings: $47.78 (+47.78)
- Other Website Advertising: $15.00 (+15.00)
Total Income: $73.16 (+64.60)
While it’s a little unexpected to see the website driving more revenue than my Android apps, I’m very happy with the way this month’s turned out. This report only covers 3 weeks, but all the key stats are still higher than last month. The jump in website traffic & engagement has helped increase awareness of my apps, and opened the door for possible business opportunities in the future.
My biggest challenge at this stage is choosing where to head next. So many doors have opened, it’s harder to prioritise than ever before. So what will I focus on this coming month (July)? Well, I’ve just launched a new app – CPU Usage Live Wallpaper – which will be my first proper “freemium” app with both a free & paid version available. Also, I’ll be trying out some alternative app stores, and possibly some other advertising networks.
Speaking of advertising networks – I’ve had some really exciting results from TapJoy in the past few days. Stuff like CPMs in the range of $25. But I’ll write about that in another post (hey, I have to keep you coming back somehow! 😉 ) I’ve also had my first experience of Google suspending one of my apps on the Android Market, which definitely deserves it’s own post.
Well, that’s all for this month. Sorry the post is a bit late, but I hope it’s been a worthwhile read. I just noticed – this post is about 1,500 words long. Is that too long to read? Should I make the monthly report shorter, or divide it up into a few reports? Let me know in the comments. Don’t want to be boring you to death 🙂